
See prices over time
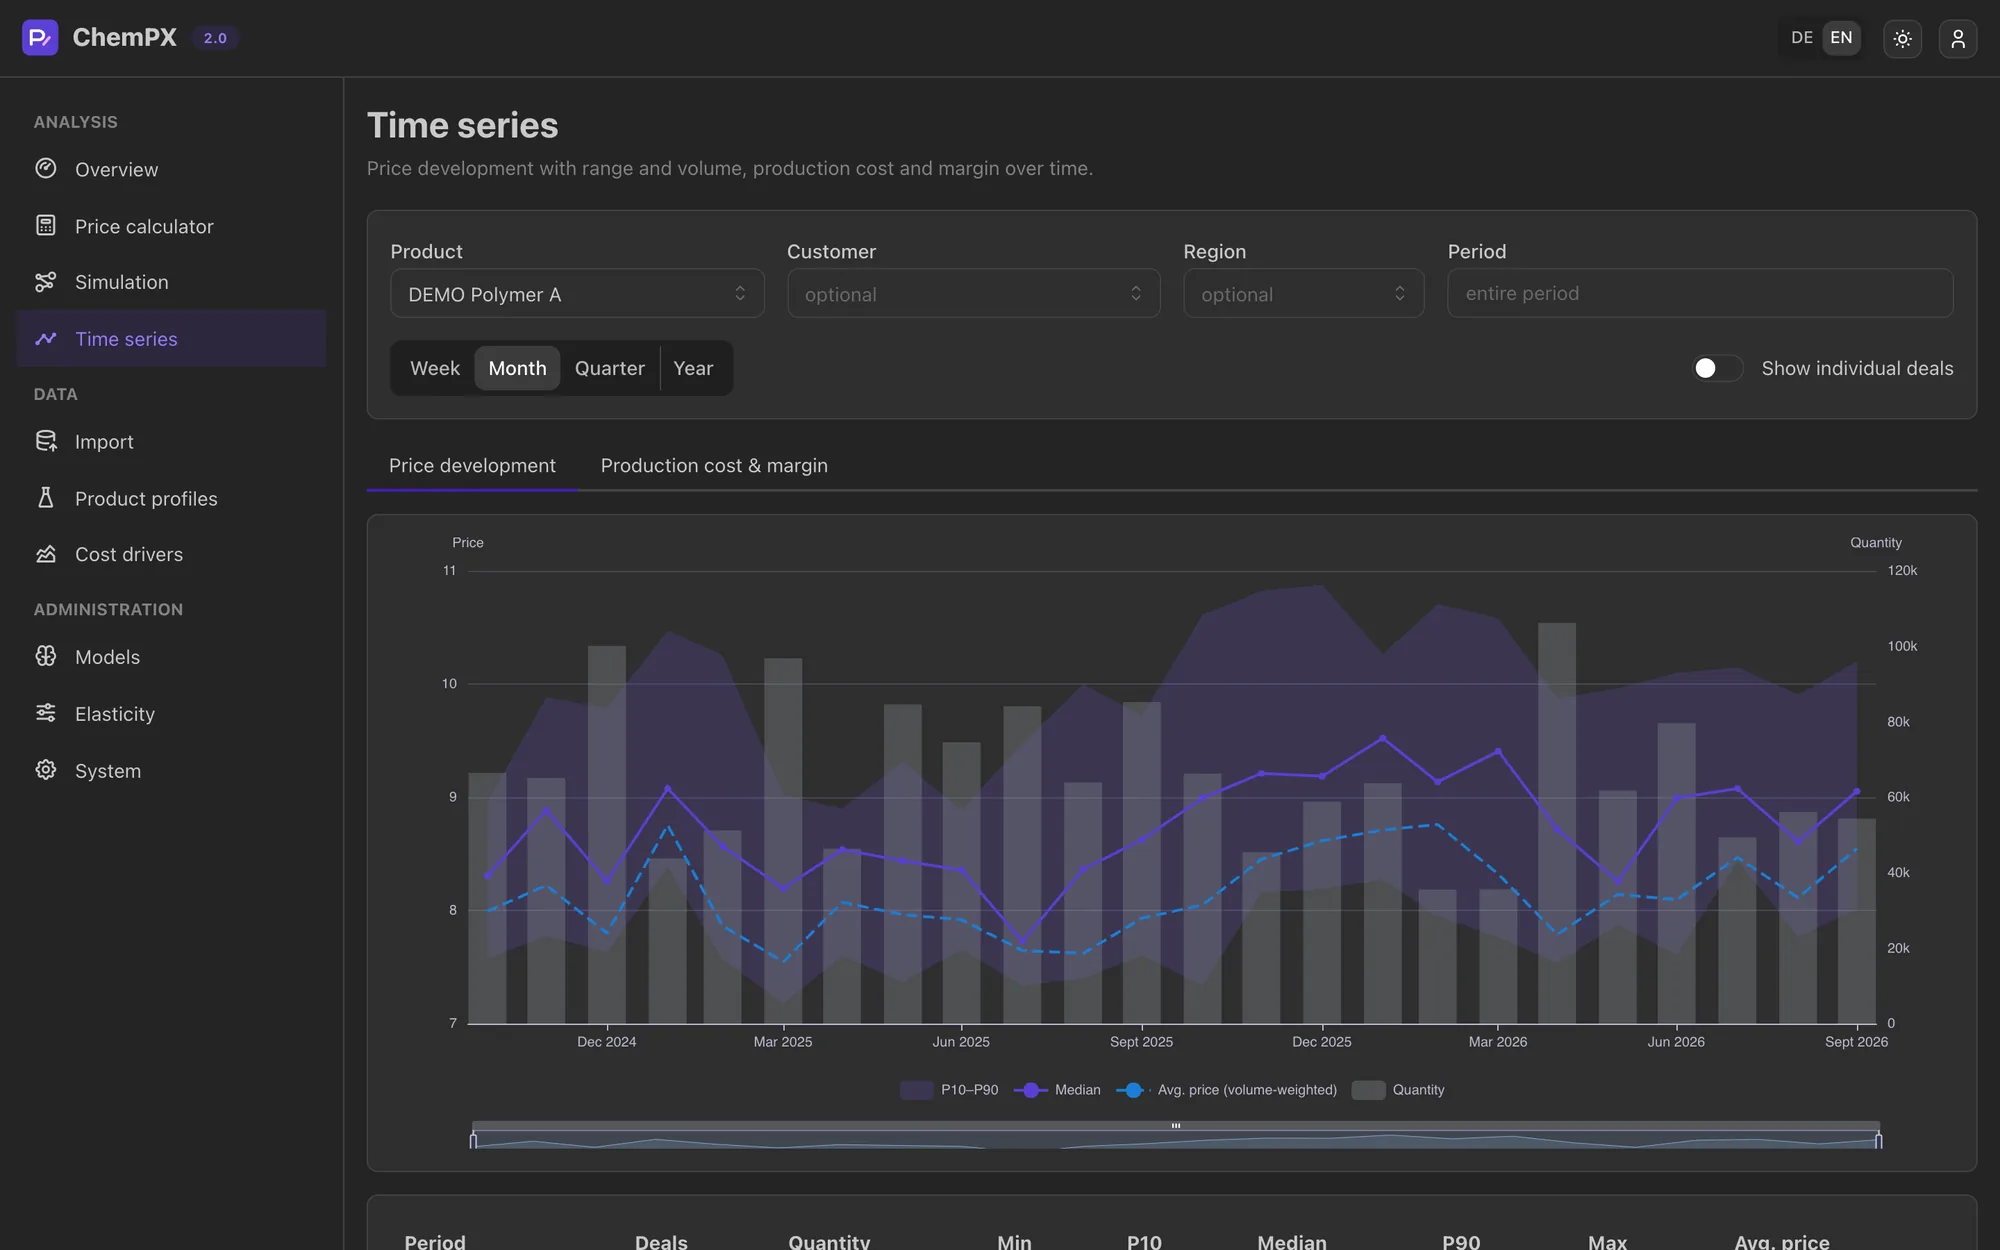
Every deal now carries a date. Follow the median, the volume-weighted average and the P10–P90 range together with volume, by week, month, quarter or year, and filter down to a customer, a region or a period.
ChemPX 2.0 is a complete rebuild of our AI-empowered pricing software for chemical products. The price calculator and the simulation carry over. New are real time series, cost-driver forecasts, margin projections, versioned price models and access for AI assistants.
Pricing in the chemical industry moves with gas, power and feedstock. ChemPX-1 answered what a price should be at one point: its sales data had no dates, and energy and raw material prices came from a fixed table.
ChemPX 2.0 is built around time. Every deal has a date, every cost driver is a measured series, and every price can be calculated for a reference date or projected forward.
Every deal now carries a date. Follow the median, the volume-weighted average and the P10–P90 range together with volume, by week, month, quarter or year, and filter down to a customer, a region or a period.
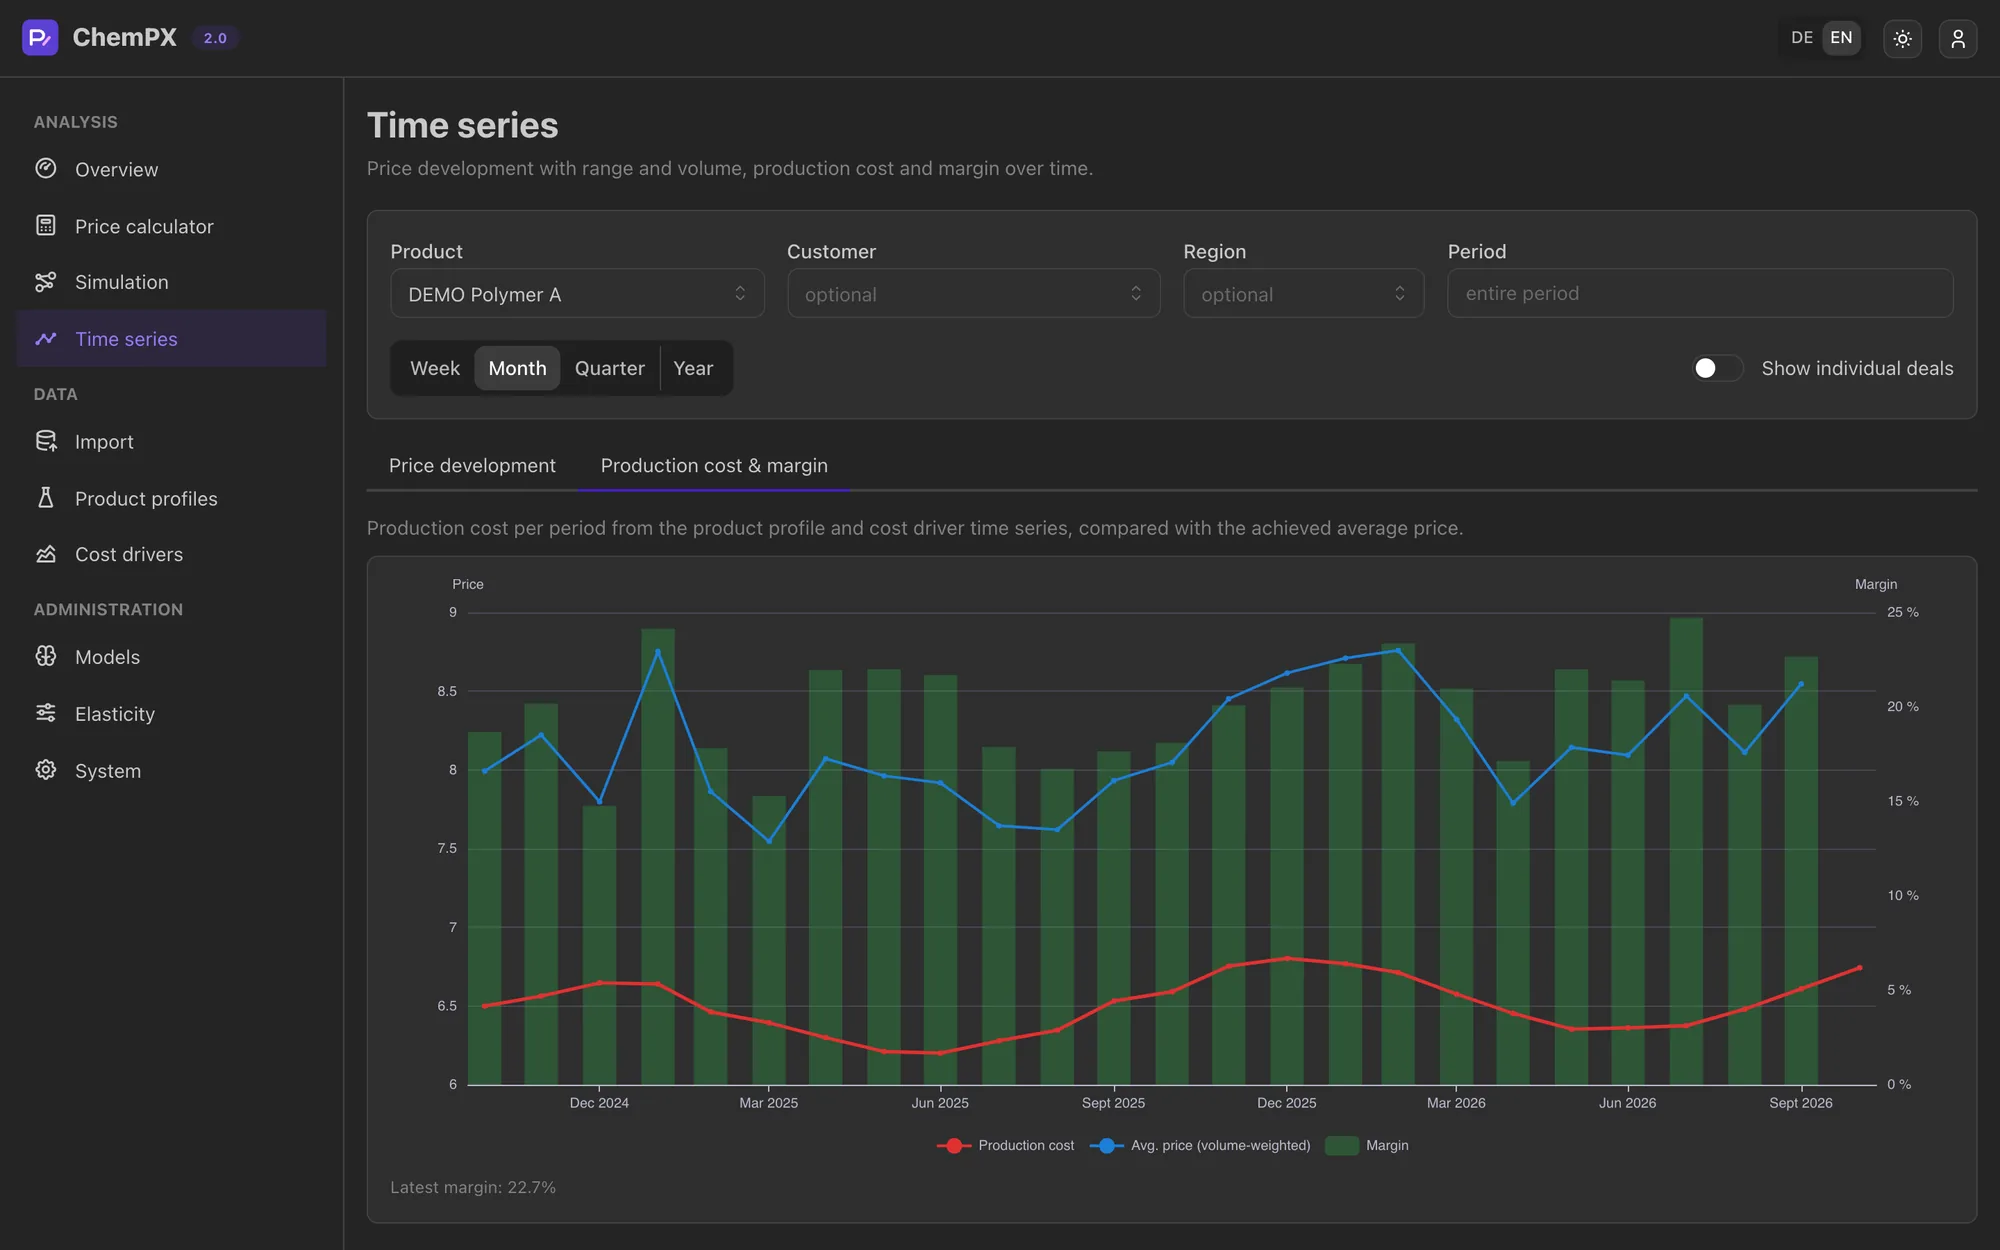
ChemPX calculates the production cost of each period from the product profile and the cost-driver prices valid at that time, and sets it against the average price you achieved. You can see whether it was your price or your cost that moved the margin.
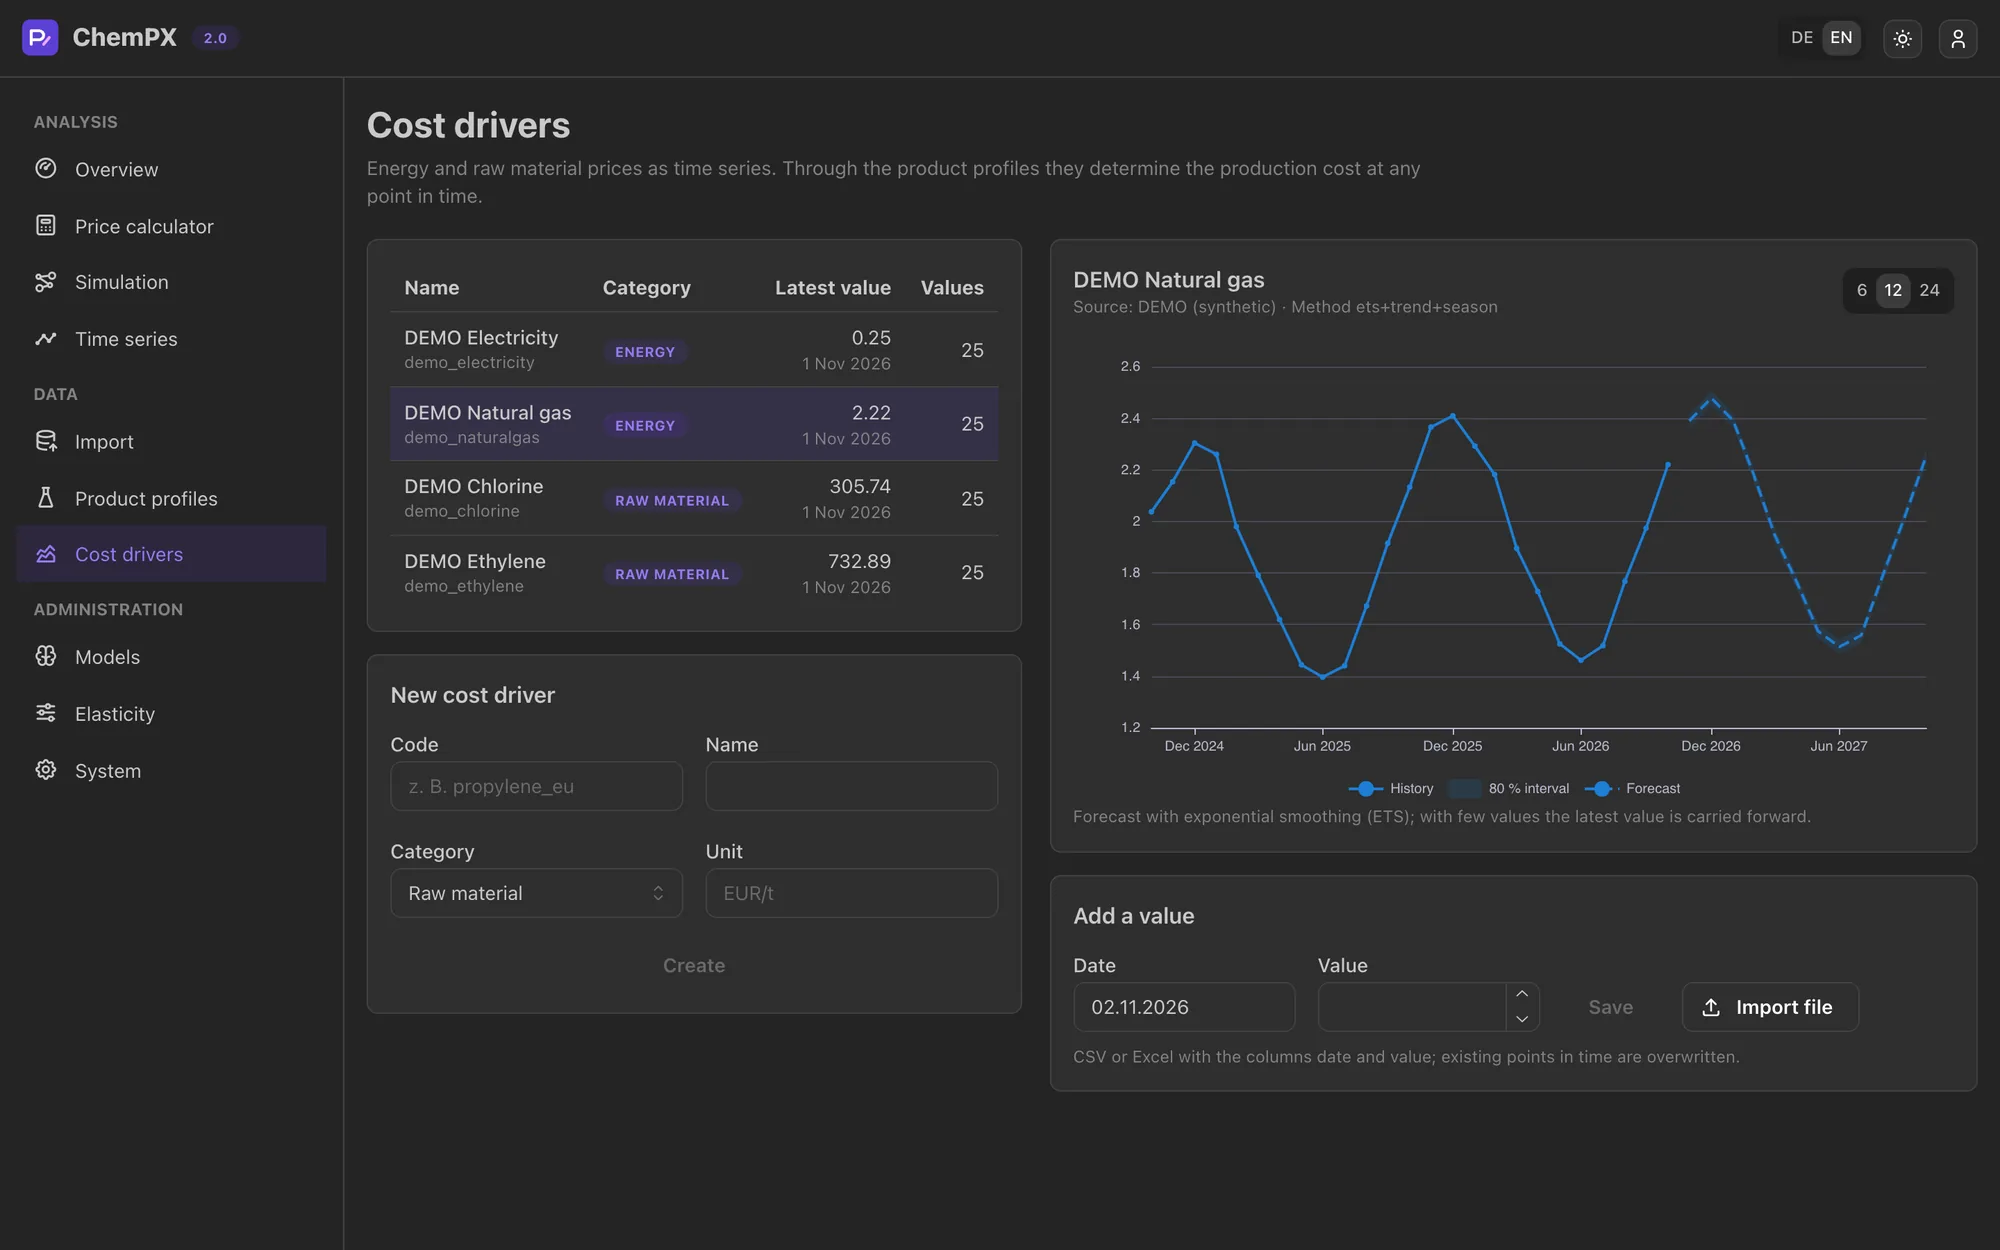
Energy and raw material prices are no longer a fixed table but time series you enter by hand or import from CSV or Excel. Forecasts use exponential smoothing, with trend and seasonality where the history supports it, and come with 80 % intervals.
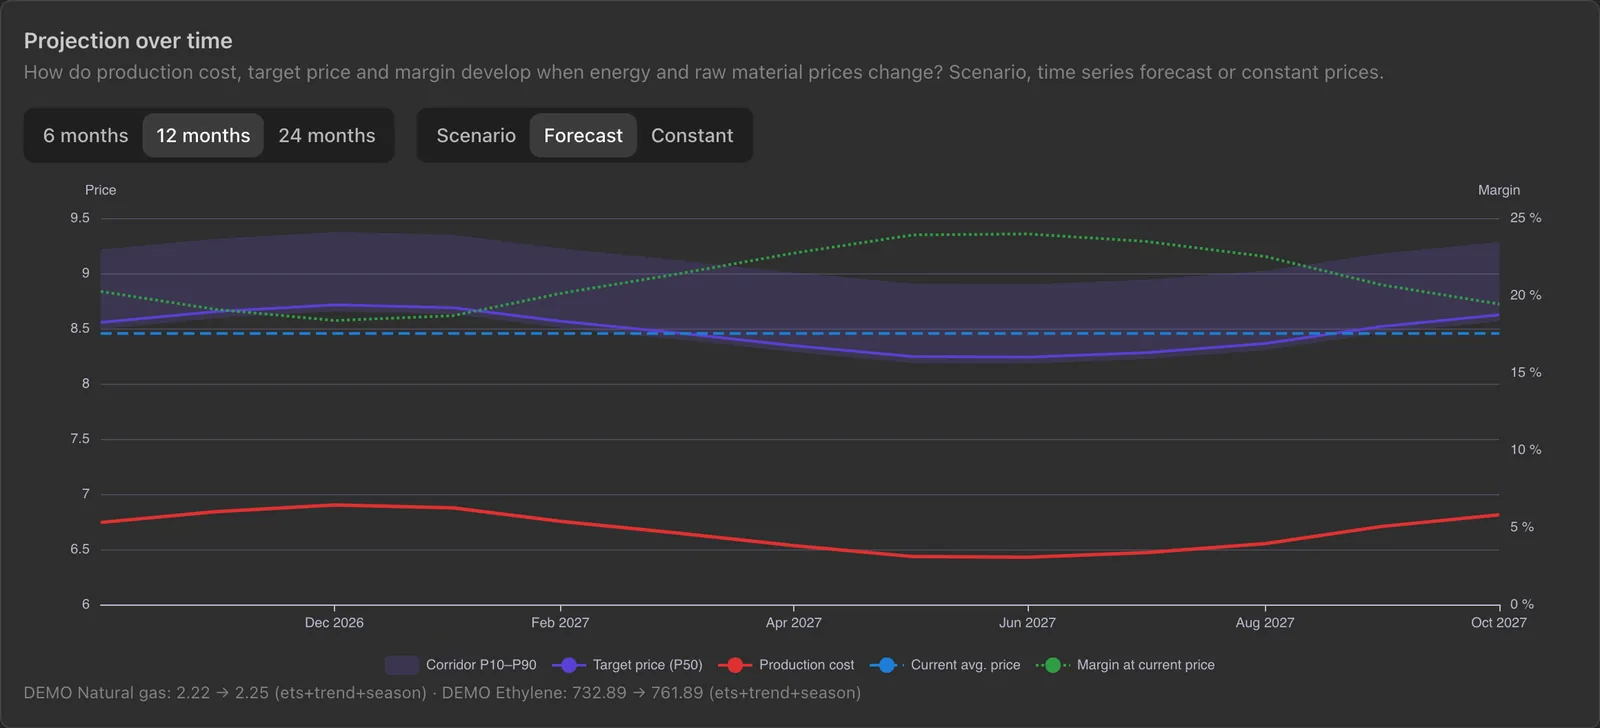
What happens to production cost, target price and margin if gas rises by 20 %? Set your own scenario per cost driver, follow the forecast or hold prices constant, over 6, 12 or 24 months.
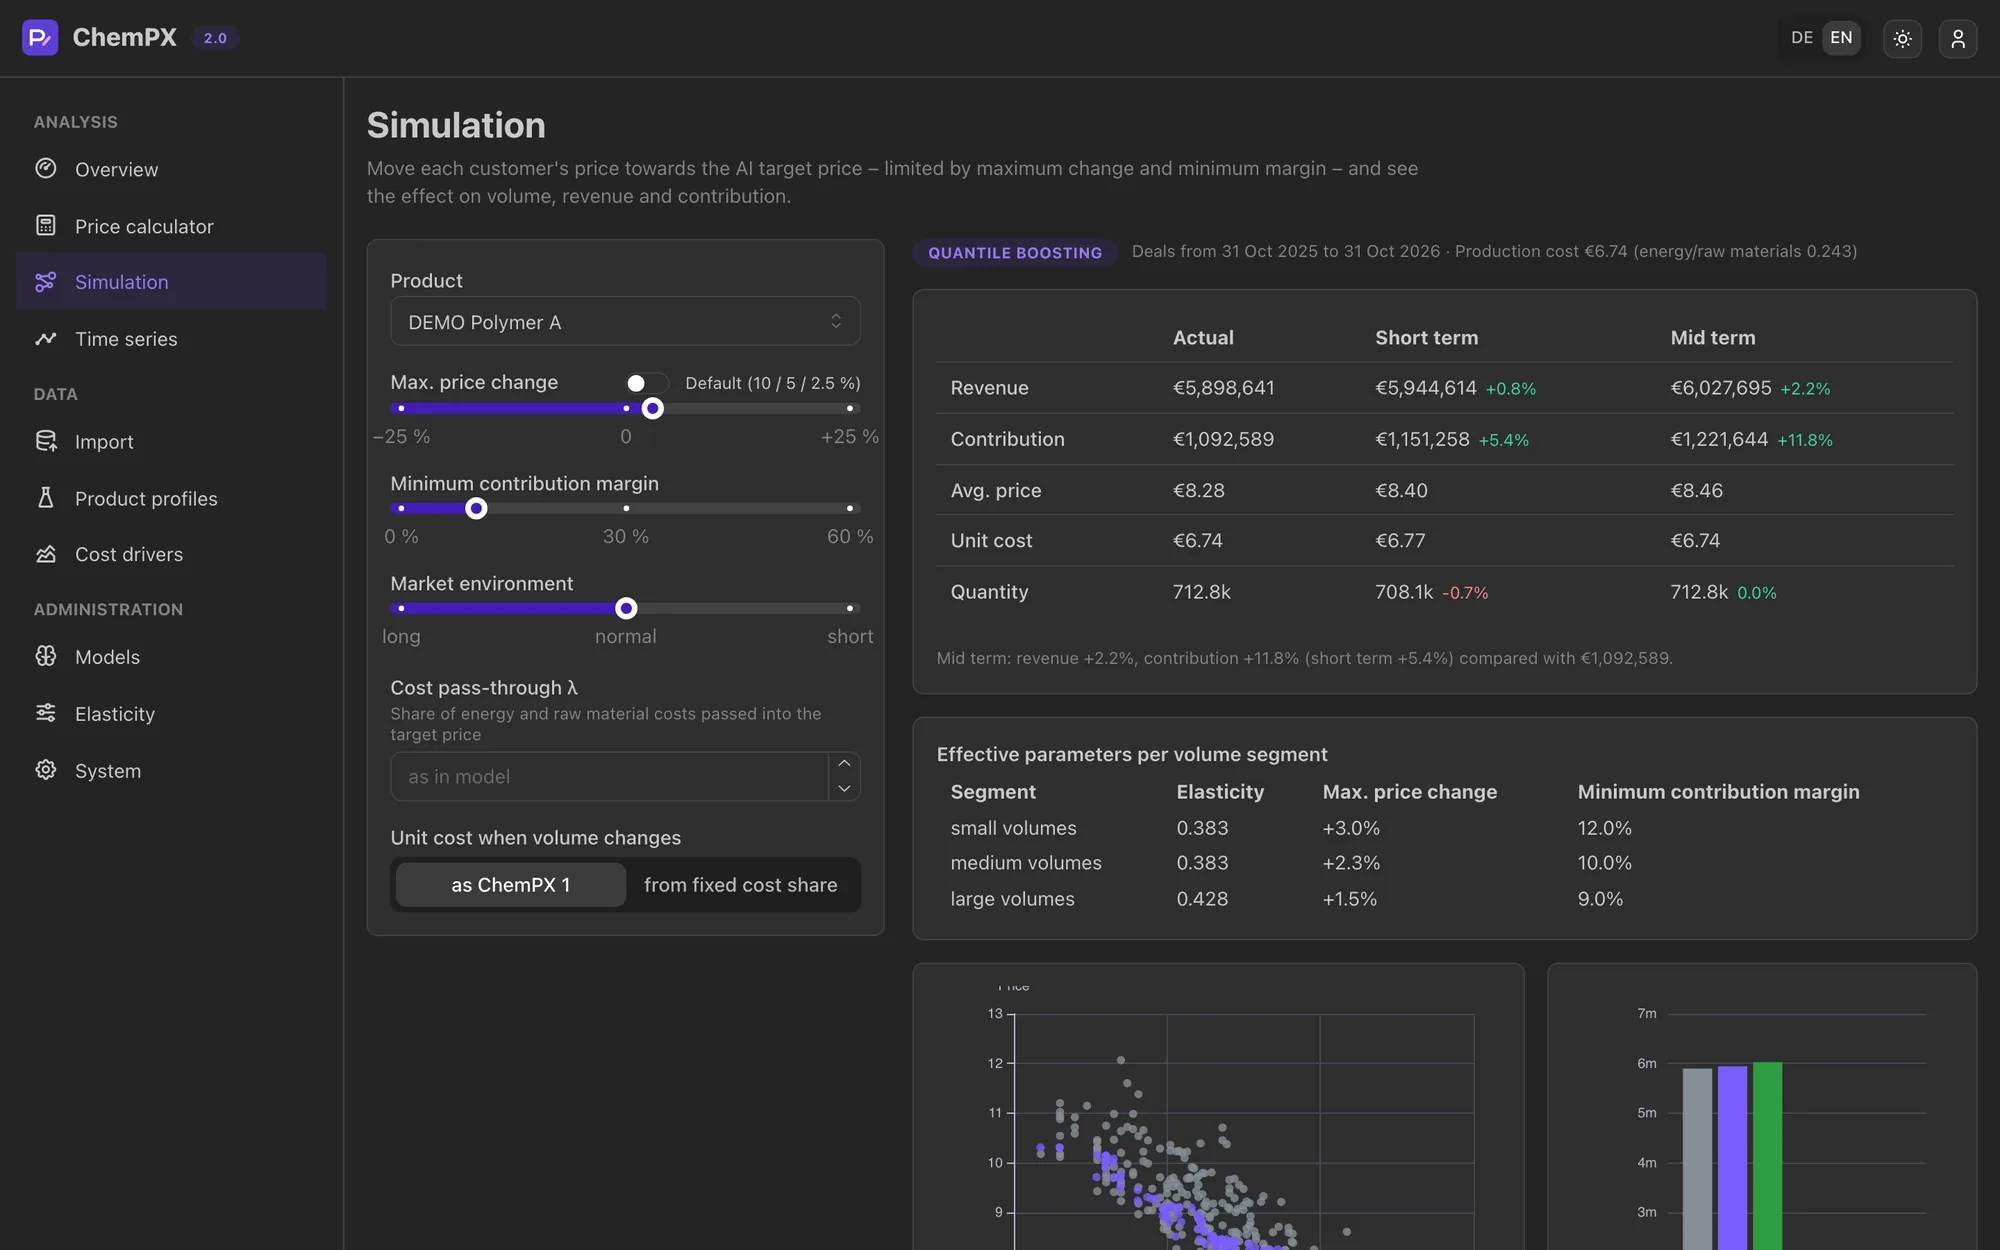
The price calculator works for any reference date and shows how energy and raw material costs flow into the price. The simulation gains an adjustable cost pass-through, a scale effect based on the fixed cost share, saved comments on price proposals, and XLSX and CSV export. Its formulas carry over from ChemPX-1 and are tested against them.
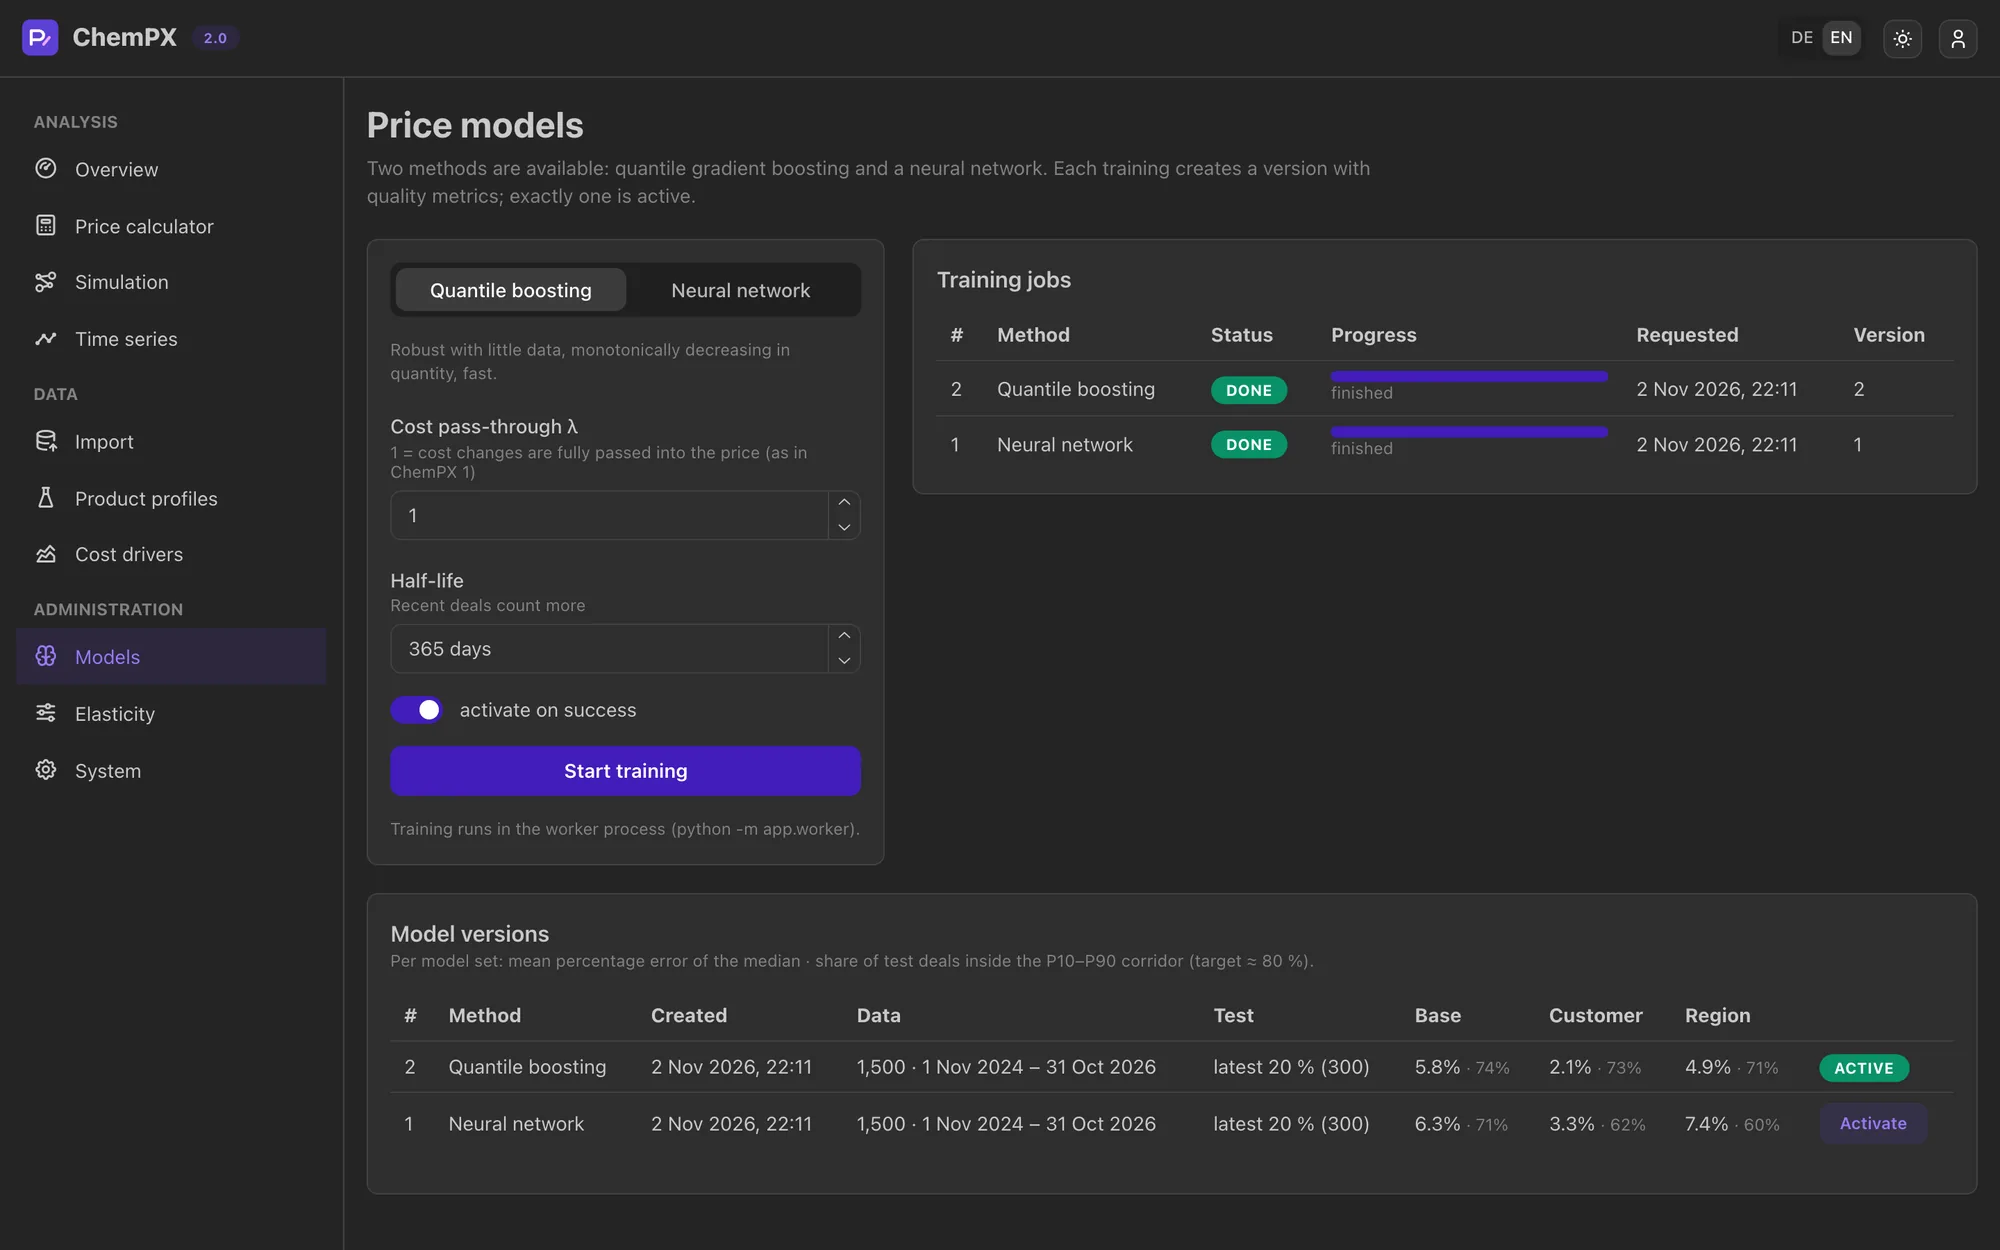
Train quantile gradient boosting, which is robust with little data, or a neural network with embeddings. Each training creates a version, tested on the most recent 20 % of your deals, with its error and corridor coverage on record. Activate the best one without a restart.
ChemPX 2.0 comes with an MCP server: 43 tools for Claude and other clients that speak the Model Context Protocol. The assistant does no pricing maths of its own. Every tool calls the ChemPX API, so the same business logic, roles and checks apply as in the web app.
Access runs through your login or a dedicated service account, and what the assistant does shows up in the activity log.
All screens on this page show synthetic demo data.
Excel and CSV with a template, a dry run and a row-by-row error list. Nothing is written until the file is valid, unless you choose to import only the valid rows.
Cost structure, cost-driver sensitivities, product class and interchangeability, each with a valid-from date.
Login through Keycloak (OIDC with PKCE), and separate roles for analysis, data and administration.
Quotes, simulations, imports and changes are logged. A full export gives you all business data as CSV files.
The interface speaks both languages, saved per user, in light and dark mode.
PostgreSQL with TimescaleDB instead of files, and a REST API documented with OpenAPI.
| Topic | ChemPX-1 | ChemPX 2.0 |
|---|---|---|
| Sales data | Without dates | Dated deals as time series |
| Energy and raw materials | Fixed table of current prices | Measured time series with forecasts |
| Time horizon | One point in time | Any reference date, projections up to 24 months |
| Price models | Neural networks | Quantile gradient boosting or neural networks, versioned with quality metrics |
| New models | Active after a restart | Active with one click, no restart |
| Data import | Excel, without validation | Excel and CSV, with validation and dry run |
| Simulation results | Comments were not kept | Comments saved, XLSX and CSV export |
| Languages | One | German and English |
| AI assistants | – | MCP server with 43 tools |
Coming from ChemPX-1? Your data can be migrated. ChemPX-1 deals have no date, so they are marked as estimated, and time series become meaningful as soon as you import dated sales data.

ChemPX 2.0 is available now for demos and pilots. Tell us about your product portfolio and we’ll show you what it can do with your data.